1. Introduction
All editions of SQL Server 2005 include debugging support (including the Express Edition). However, only the Team Systems and Professional editions of Visual Studio enable stored procedure debugging from within the IDE. In short, if you are using Visual Web Developer or Visual Studio Standard Edition then you cannot step through a stored procedure or enter the stored procedure via application debugging.
2. Location of the debugging Database
Another factor that must be taken into account when debugging SQL Server objects is the location of the SQL Server database with respect to the development machine. The database instance being debugged may be either local or remote. A local database instance is one that resides on the same machine as the development machine; a remote one resides on some other computer. Debugging a local database instance requires no extra configuration steps. Debugging a remote instance, however, is more complicated.
This article focuses on Direct Database Debugging and Application Debugging on a local database instance. In particular, we will be debugging a SQL Server 2005 Express Edition database in the “App_Data” folder; the database and demo web application is available for download at the end of this article. A future article will look at debugging from a SQL Server Project. The sidebar below provides some hints for debugging a remote database instance.
3. The Different Types of SQL Server Debugging
For Microsoft SQL Server 2005, all database debugging occurs from within the Visual Studio IDE. Database objects like stored procedures, triggers, and User-Defined Functions (UDFs) can be debugged. Visual Studio offers three ways to debug these database objects:
• Direct Database Debugging - from Visual Studio's Server Explorer, right-click on a database object and choose to step into the object. For example, when right-clicking on a stored procedure, the context menu includes a menu option titled "Step Into Stored Procedure."
• Application Debugging - with application debugging you can set breakpoints within a database object. When the associated ASP.NET application is debugged and the database object invoked, Visual Studio's debugger pauses the application's execution as the breakpoint it hit, allowing us to step through the object's statements one at a time.
• Debugging from a SQL Server Project - Visual Studio offers a SQL Server Project type. This project can include both T-SQL and managed database objects and these objects can be debugged by debugging the SQL Server Project itself.
We will be looking at the first 2 methods of debugging viz. Direct Database Debugging, Application Debugging.
a. Debugging a Stored Procedure via Direct Database Debugging
Direct Database Debugging is the simplest way to debug a SQL Server 2005 stored procedure. From Visual Studio's IDE you can opt to step into a stored procedure and then step through each of its statements one at a time, inspecting and changing T-SQL variables and parameters within the stored procedure.
To step into the a stored procedure, navigate to the Server Explorer window, drill down into the stored procedures, right-click on the Stored Procedure node and choose the "Step Into Stored Procedure" option from the context menu. (Note: SQL Server debugging support is only available in the Team Systems and Professional editions of Visual Studio.)

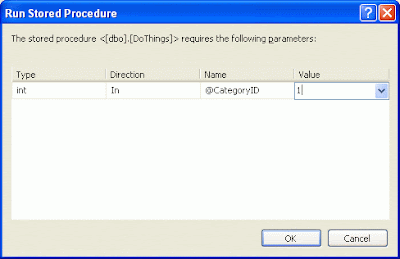
This will start the debugger and execute the stored procedure. IF the stored Procedure expects some parameters, a dialog box prompts us to provide this value. Enter the value(s) and click OK.

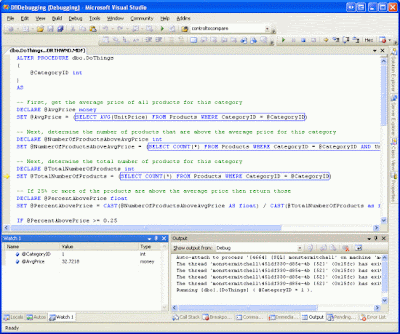
Execution will start at the first statement. You can step from statement-to-statement using the Step Into or Step Over commands (F11 or F10 on the keyboard, respectively), as well as add parameters and variables to the Watch window. The screen shot below shows the stored procedure while being stepped through. The yellow arrow in the margin in the left indicates what statement is currently being executed.

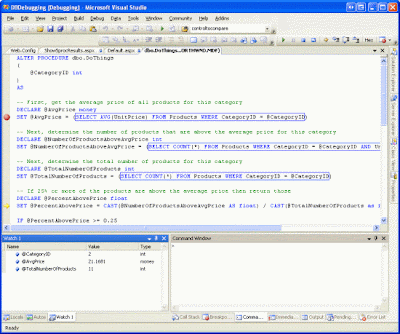
After the stored procedure completes, the results can be viewed through the Output window.
As you can see, Direct Database Debugging is very easy to launch, use, and understand. Simply right-click on a stored procedure from the Server Explorer, choose the "Step Into Stored Procedure" option, and you're off and running.
b. Debugging a Database Object from a Running Application
Direct Database Debugging makes it easy to debug a stored procedure directly from within the Visual Studio IDE. In some cases, however, we would rather start debugging a database object when it is called from an ASP.NET application. This would allow us to better understand when a particular database object was invoked and its state.
This style of debugging is referred to as Application Debugging. To use this style of debugging we need to perform the following steps:
• Add breakpoints to the database object(s) that you want to debug. A database object will only be debugged if it contains a breakpoint. For example, you cannot "Step Into" a stored procedure from application code that calls the stored procedure. Rather, you must explicitly set a breakpoint within the stored procedure itself.
• Configure the application to debug SQL Server objects. As we will see shortly, this is as simple as checking a checkbox.
• Update the connection string to disable connection pooling. Connection pooling is a performance enhancement that allows an application to connect to a database from an existing pool of connections. This feature, if enabled, does not correctly construct the debugging infrastructure needed on the connection taken from the pool. Since connection pooling is enabled by default, we must update our connection string to disable connection pooling during the timeframe that application debugging is being used. (After you've completed debugging the SQL Server objects via application debugging be sure to reinstate connection pooling.)
Let's tackle each of these steps one at a time. 1
First, open the DoThings stored procedure in Visual Studio and set a breakpoint on the first statement (DECALRE @AvgPrice money). One task down, two to go!
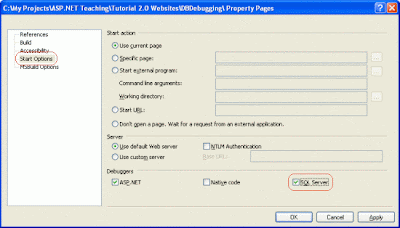
To configure the ASP.NET application to support SQL Server debugging, right-click on the Project name in the Solution Explorer and choose the Property Pages from the context menu. This will bring up the dialog box shown below. Go to the Start Options tab and check the "SQL Server" checkbox in the Debuggers section. Two tasks down, one to go!

Lastly, we need to update the connection string used by the application to disable connection pooling. To accomplish this simply tack on the attribute Pooling=false to you existing connection string. Assuming the connection string information is defined within Web.config's section, you would update the connection string value like so:
All three tasks have now been completed! To test the application debugging, create an ASP.NET page that invokes the DoThings stored procedure. The demo available for download at the end of this article has such a page. When debugging the ASP.NET application and visiting this page, the breakpoint in the stored procedure is hit and control is delegated to the debugger. Once in the debugger we can step through the stored procedure's statements and view and edit the parameter values and variables through the Watch window, just like with Direct Database Debugging.

Reference:
1. http://aspnet.4guysfromrolla.com/articles/051607-1.aspx
